Note
Click here to download the full example code
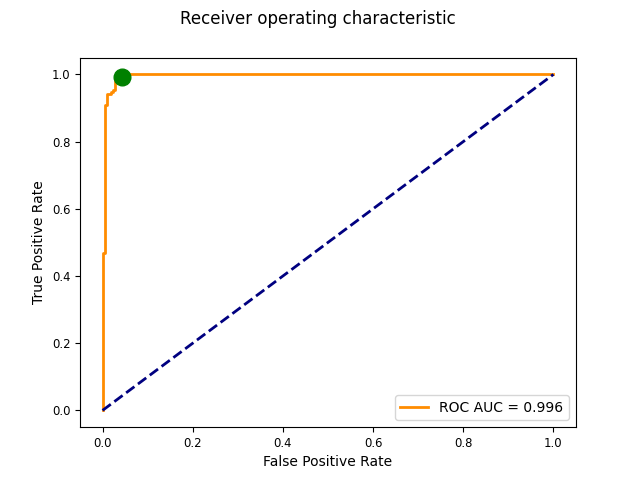
Receiver Operating Characteristic Curve
Example of plotting the ROC curve for a classification task.
import matplotlib
import matplotlib.pyplot as plt
import numpy as np
from sklearn.datasets import load_breast_cancer
from sklearn.metrics import roc_curve, roc_auc_score, confusion_matrix
from sklearn.preprocessing import StandardScaler

from sklvq import GMLVQ

matplotlib.rc("xtick", labelsize="small")
matplotlib.rc("ytick", labelsize="small")

data, labels = load_breast_cancer(return_X_y=True)
Create a GMLVQ object and pass it a distance function, activation function and solver. See the API reference under documentation for defaults.
Fit the GMLVQ object to the data and plot the roc curve.
# Object to perform z-transform
scaler = StandardScaler()

# Compute (fit) and apply (transform) z-transform
data = scaler.fit_transform(data)

# Train the model using the scaled X and true labels
model.fit(data, labels)

# Get the decision values (which are used in predict) instead of the labels. The values are with
# respect to the "greater" class, i.e., index 1.
label_score = model.decision_function(data)

# roc_curve expects the y_score to be with respect to the positive class.
fpr, tpr, thresholds = roc_curve(
    y_true=labels, y_score=label_score, pos_label=1, drop_intermediate=True
)
roc_auc = roc_auc_score(y_true=labels, y_score=label_score)

#  Sometimes it is good to know where the Nearest prototype classifier is on this curve. This can
#  be computed using the confusion matrix function from sklearn.
tn, fp, fn, tp = confusion_matrix(y_true=labels, y_pred=model.predict(data)).ravel()

# The tpr and fpr of the npc are then given by:
npc_tpr = tp / (tp + fn)
npc_fpr = fp / (fp + tn)

fig, ax = plt.subplots()
fig.suptitle("Receiver operating characteristic ")
# Plot the ROC curve
ax.plot(fpr, tpr, color="darkorange", lw=2, label="ROC AUC = {:.3f}".format(roc_auc))
# Plot the random line
ax.plot([0, 1], [0, 1], color="navy", lw=2, linestyle="--")
# Plot the NPC classifier
ax.plot(npc_fpr, npc_tpr, color="green", marker="o", markersize="12")
ax.set_xlabel("False Positive Rate")
ax.set_ylabel("True Positive Rate")
ax.legend(loc="lower right")
ax.grid(False)
Total running time of the script: ( 0 minutes 0.221 seconds)